Thelander PC Digest: February 2024
What’s the Relationship Between Company Valuations, Total Amount of Financing and CEO Compensation?
In September 2022, Fortune used Thelander data to look at CEO compensation by financing and valuation. With the challenging fundraising environment, private companies staying private longer and shifting valuations, we wanted to see how the data has changed.
Chart 1 looks at CEO median total cash year-over-year by total financing. Our data shows:
- The median total cash has generally increased since 2020 for every financing bracket (except for in the $15 – $49.9 million category).
- The biggest increase can be seen in the $90 million+ category, where the total cash went from $450,000 (2020) to $509,050 (2023).
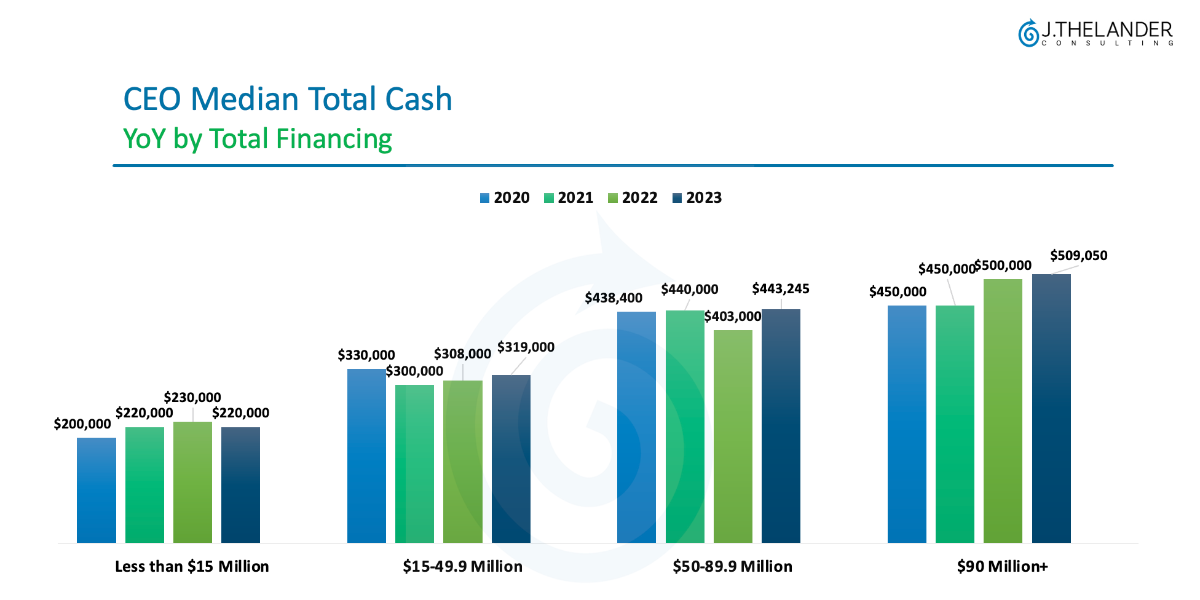
Chart 2 looks at CEO median total cash year-over-year by valuation.

Compensation by valuation tends to fluctuate more than the total amount of financing.
The pattern for median total cash by valuation is similar to total amount of financing. Since 2020, the median total cash has generally increased, with the exception of the $90 – $199.9 million category in 2023 compared to 2020.
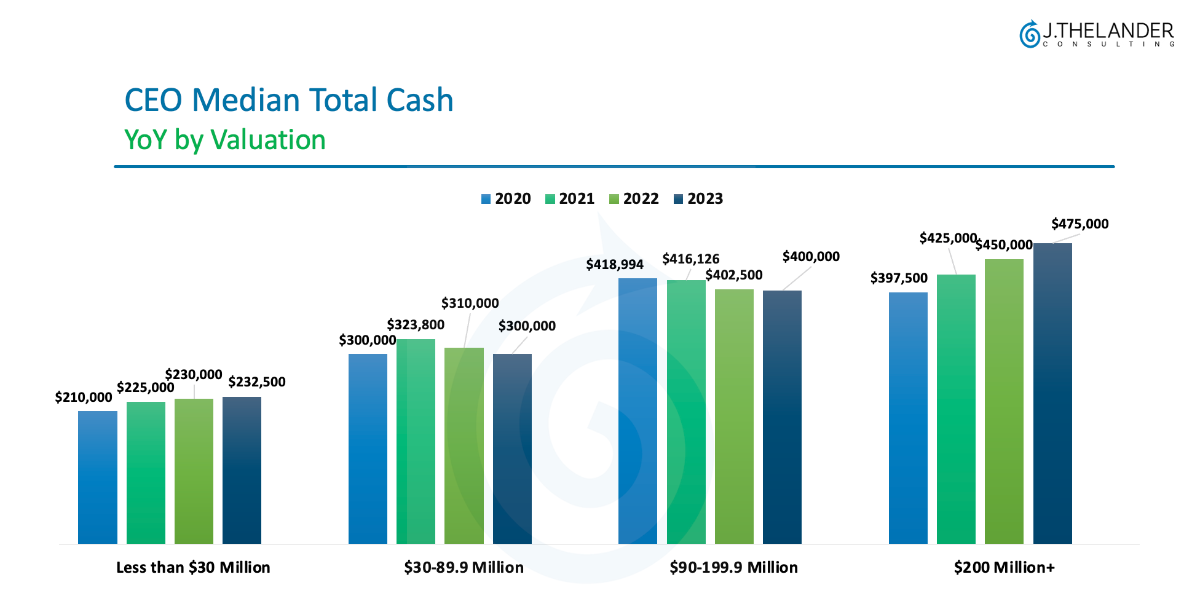
Chart 3 looks at CEO median non-founder equity year-over-year by total financing. Our data shows:
The non-founder equity has been growing at the lowest financing level. At higher financing levels, the non-founder equity has stayed relatively stable.
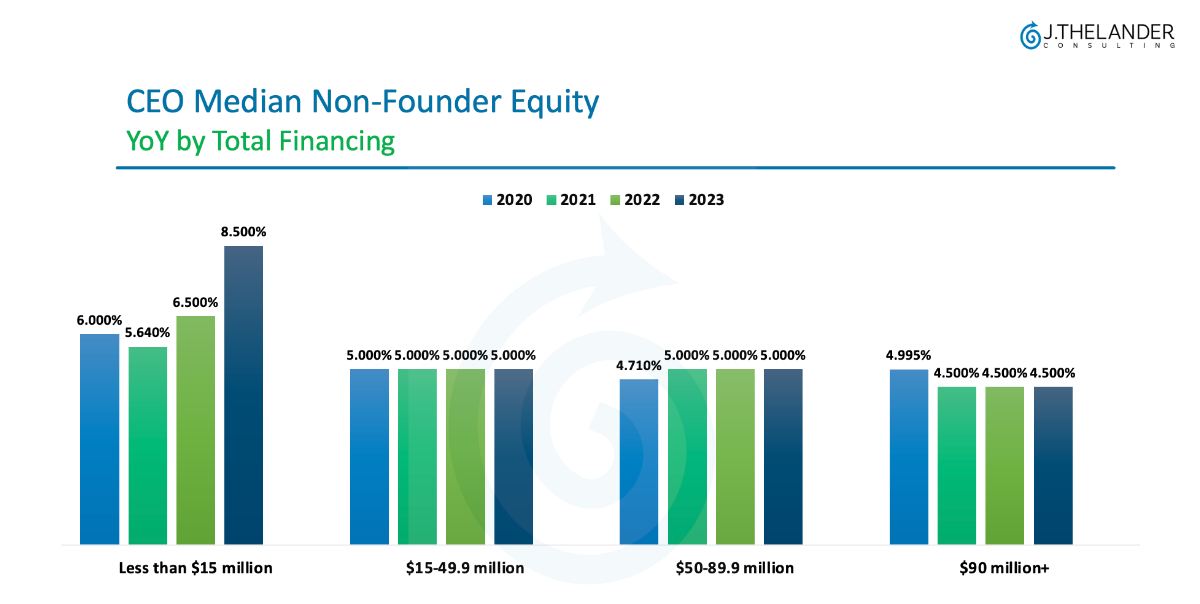
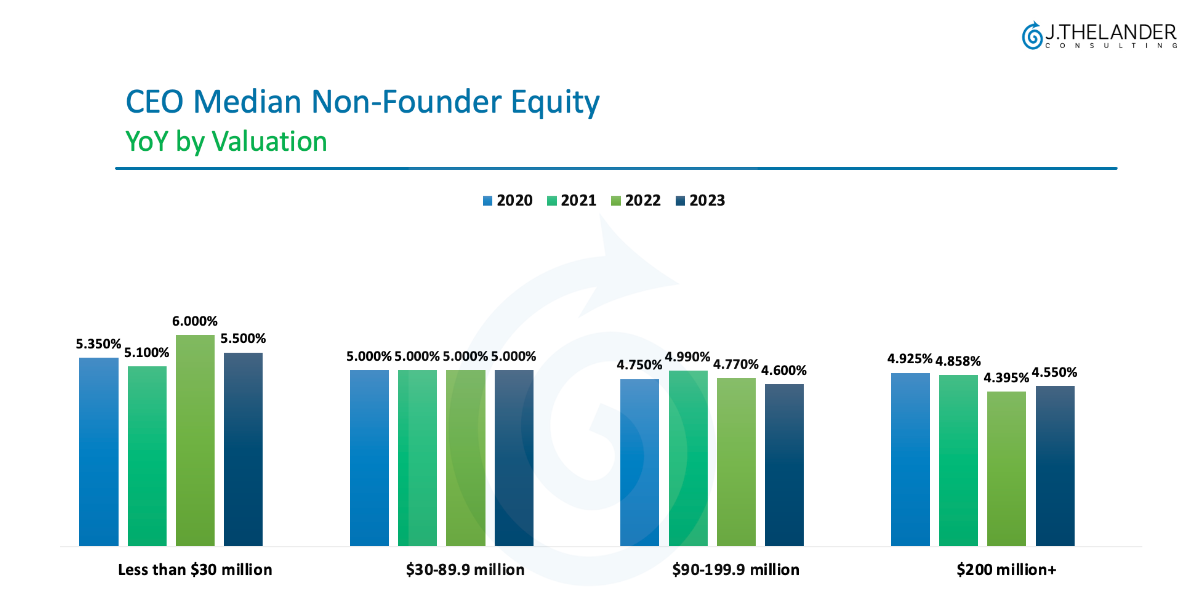
Chart 4 looks at CEO median non-founder equity year-over-year by valuation.
Non-founder equity percentages are lower for companies with a valuation of less than $30 million compared to less than $15 million in total financing.
The need for current, real-time, vetted, and trustworthy compensation data that includes cash, equity, option pool, outside board comp is more important now than ever. We invite you to participate in the Thelander Private Company Compensation Survey to secure free access to compensation data on the Thelander platform for fifty positions. Learn more about what’s covered here.
Tags: Newsletter, Private Company