Thelander IF Digest: September 2023
What Trends Do We See with Carry Dollars at Work?
Welcome to September’s Thelander Digest! A few years ago, we added new questions to the Thelander-PitchBook Investment Firm Compensation Survey to collect data on carry dollars at work. Using this data, we’ll be looking at insights on carry dollars at work and how it has changed since 2021.
What is carry dollars at work? It’s defined as the amount of carry you will receive if your funds achieve a 2x gross multiple funds.
Below, you’ll find three charts that show how carry dollars at work have changed year-over-year for investment professionals by total AUM. Let’s dive into the data!
Chart 1 shows the median carry dollars at work for firms with less than $500 million in total AUM.
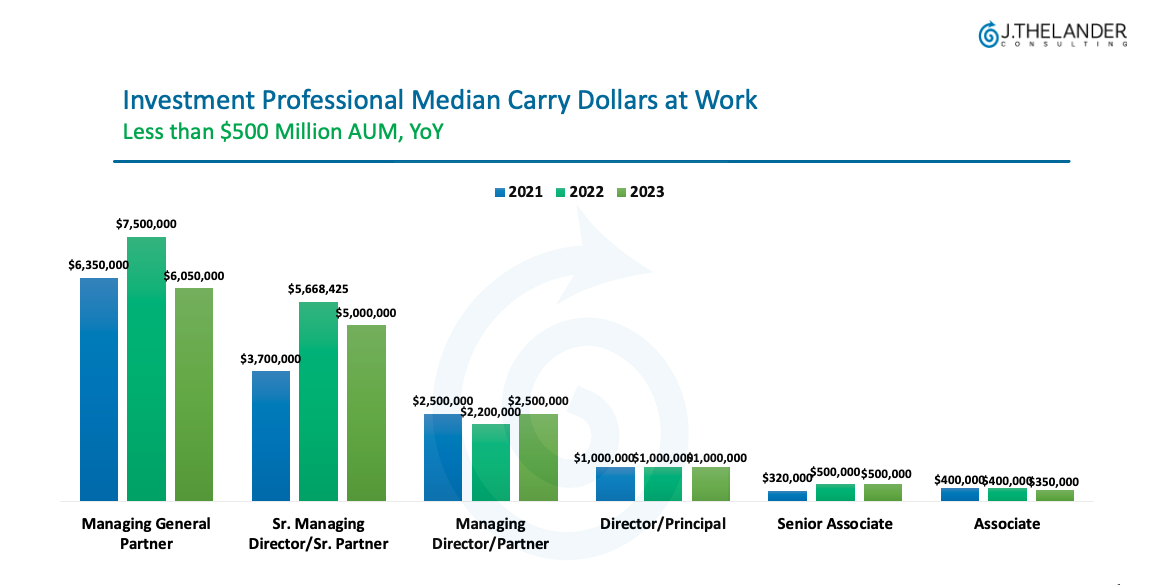
What does the data show us?
- The carry dollars at work for Director / Principal, Senior Associate and Associate has remained relatively steady (if not the same) since 2021 for under $500 Million in total AUM.
- Sr. Managing Director / Sr. Partner and managing general partner had carry dollars at work peak in 2022.
Chart 2 shows the median carry dollars at work for firms with $500 – $999 million in total AUM.
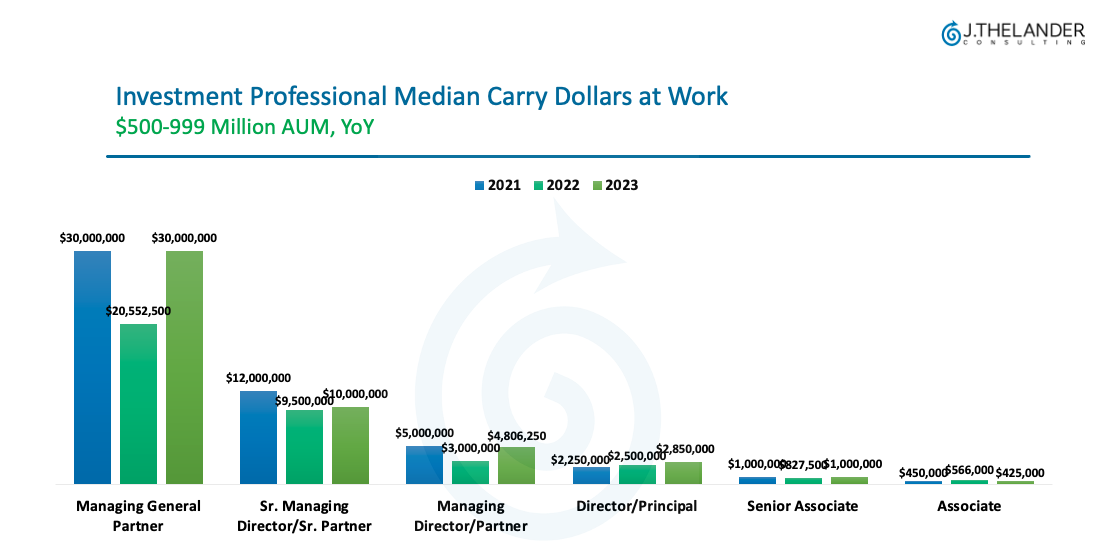
What does the data show us?
- Similar to under $500 Million AUM, the carry dollars at work stayed steady for Director/Principal, Senior Associate and Associate since 2021 with slight variations.
- What changed? The amounts of carry dollars at work is higher for each position with the higher AUM class.
- The carry dollars at work dipped in 2022 for Managing General Partners before going back to where it was in 2021.
Chart 3 shows the median carry dollars at work for firms with more than $1 Billion in total AUM.
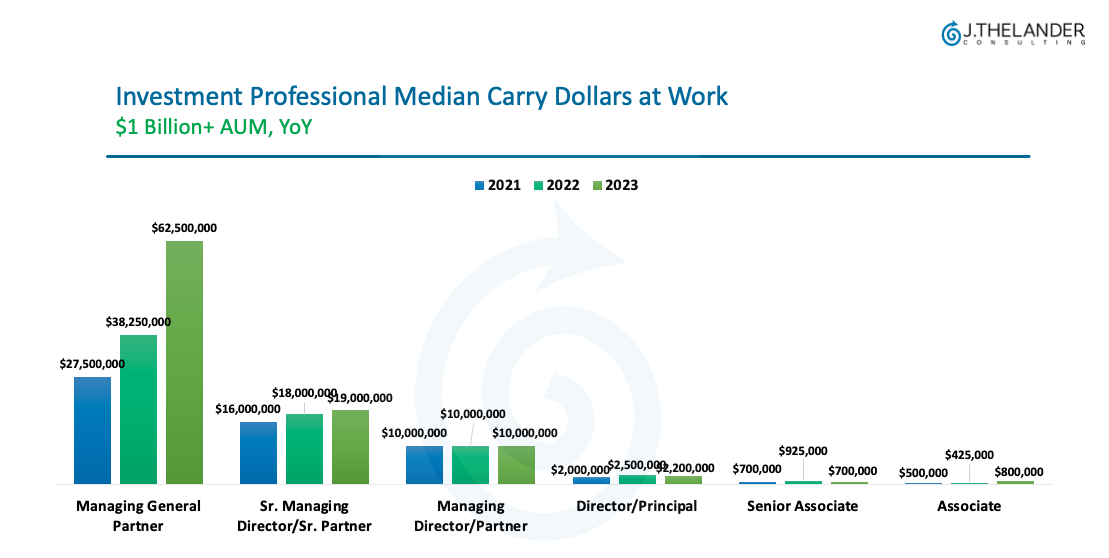
Once you cross the $1 Billion+ threshold, the data shows:
- The carry dollars at work for Managing Director / Partner, Director / Principal, Senior Associate and Associate has remained steady since 2021.
- The biggest increase can be seen for Managing General Partners – where the median carry dollars at work has nearly doubled since 2021.
Chart 4 shows how the vesting time for carried interest is impacted by total AUM.
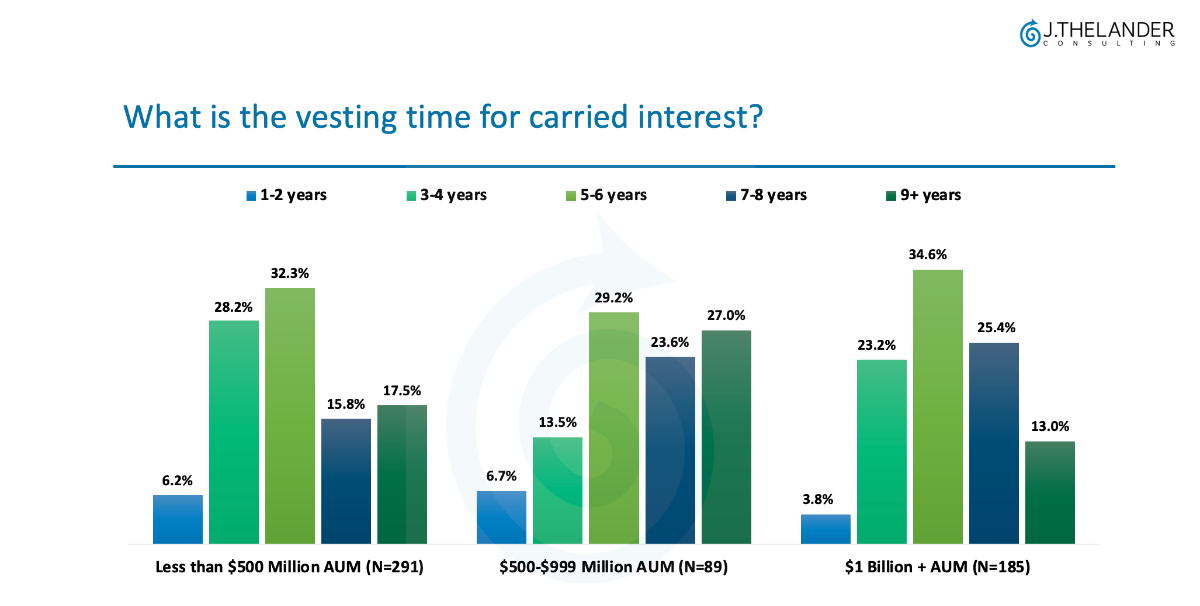
The most popular option for vesting time – regardless of total AUM – is 5 to 6 years.
Participate In The Investment Firm Compensation Survey Here for More Compensation Data
| Interested in learning how your compensation compares to the market? We invite you to participate in the no-cost Thelander-PitchBook Investment Firm Compensation Survey. The survey covers 75+ titles from managing general partner to entry-level analyst, and includes questions on base salary, bonuses, carry dollars at work, and more. When you participate, you can trial the platform and see how your compensation compares to market for a subset of jobs. plus upgrade at a discounted price! |