Thelander PC Digest: August 2023
Does Stage of Development Impact Compensation for Biotech Companies?
For our August newsletter, we look at data from biotech companies to see how stage of development impacts compensation for its CEOs.
The different stages of development can be categorized into five groups:
1) Pre-Clinical 2) First in Man 3) FDA Clinical Trial Phase I 4) FDA Clinical Trial Phase II 5) Commercial
Chart 1 shows the median for total cash, founder, and non-founder equity for CEOs by biotech stage of development. Thelander data shows:
- As you move from Pre-Clinical to FDA Clinical Trial Phase II, compensation increases from $380,625 to $450,000.
- The median founder equity peaked at FDA Clinical Trial Phase I at almost 19%.
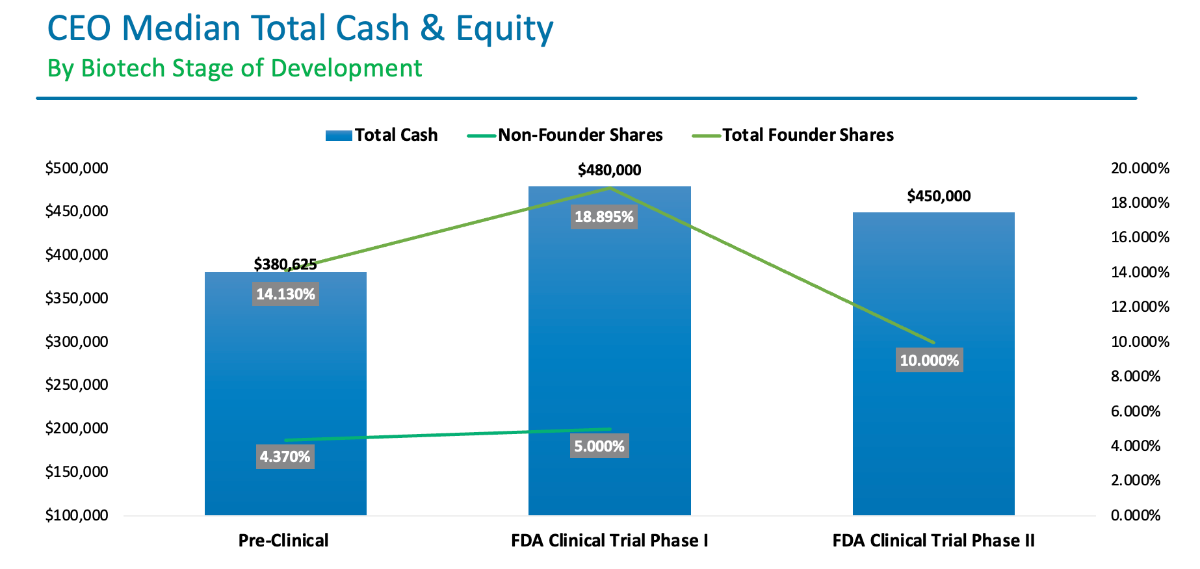
Chart 2 shows the 75th percentile for total cash, founder, and non-founder equity for CEOs by biotech stage of development. We see the following:
- The compensation is more competitive across all biotech stages of development. The highest being in FDA Clinical Trial Phase I.
- The founder equity decreases from 28% to just over 13% as you move from Pre-Clinical to FDA Clinical Trial Phase II. However, the non-founder equity stays stable around 6%.
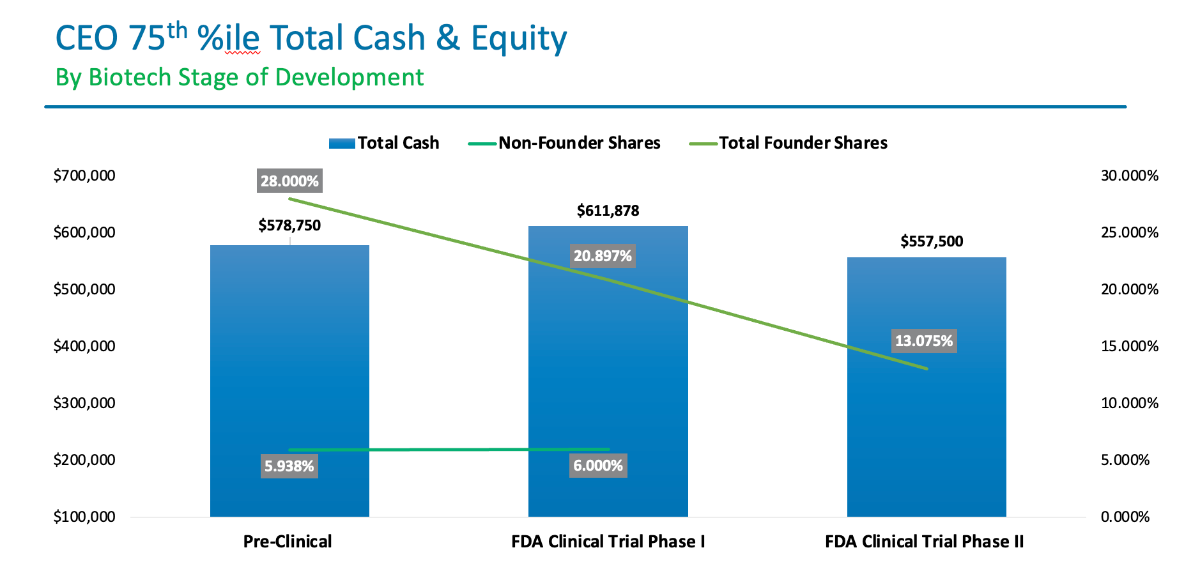
Chart 3 shows the median and 75th percentile for CEO total cash across all five stages of development.
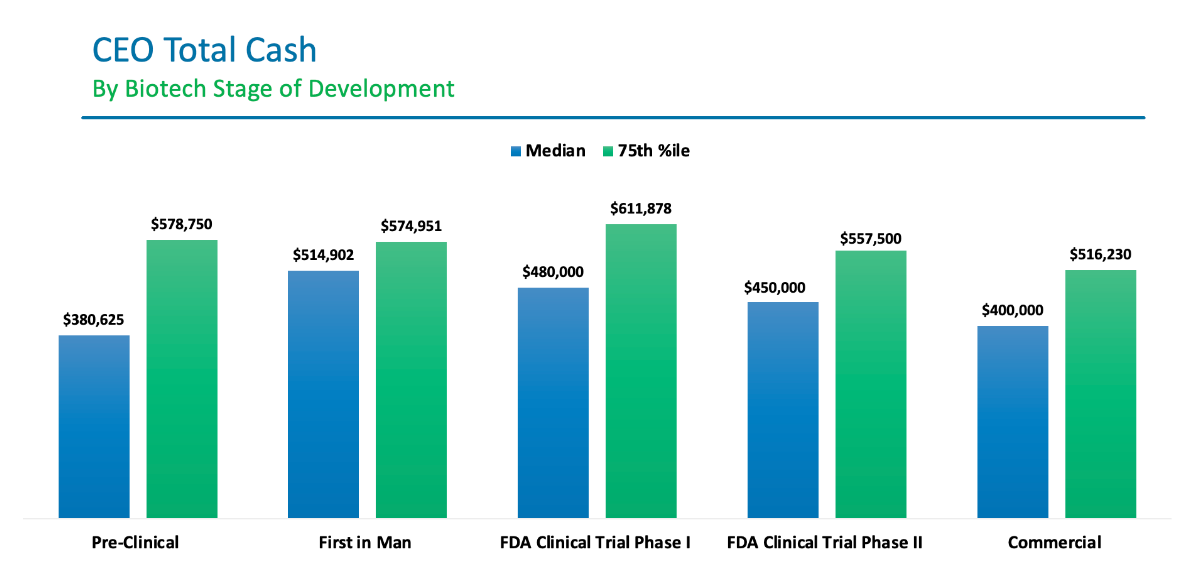
Our Findings: The industry and total amount of financing make a difference in executive compensation. Our data clearly portrays that the stage of development for biotech companies impacts compensation as well.
Know someone that would find this data interesting?
Invite them to subscribe to the Thelander Monthly Digest here.
Want more compensation data? Participate in the Thelander Private Company Compensation Survey Here
| The Thelander Digest is powered by the Thelander Private Company Compensation Survey & Online Platform. Thelander has been surveying privately held companies for more than 25 years. The result? An, interactive platform with real-time data on base salaries, actual & target bonuses, total cash and founder / non-founder equity for more than 300 positions. When you participate in the Thelander Private Company Compensation Survey here, you can trial the platform and see how your compensation compares to market for a subset of jobs & upgrade at a discounted price. |