Thelander IF Digest: July 2023
United States vs. EuropeInvestment Professional Compensation
Since Thelander surveys private companies and investment firms globally, we are frequently asked about regional compensation data within the United States and internationally. Per popular demand, July’s Thelander Digest compares how investment professionals are compensated in the United States vs. Europe. Europe data is reported in USD. Let’s take a look!
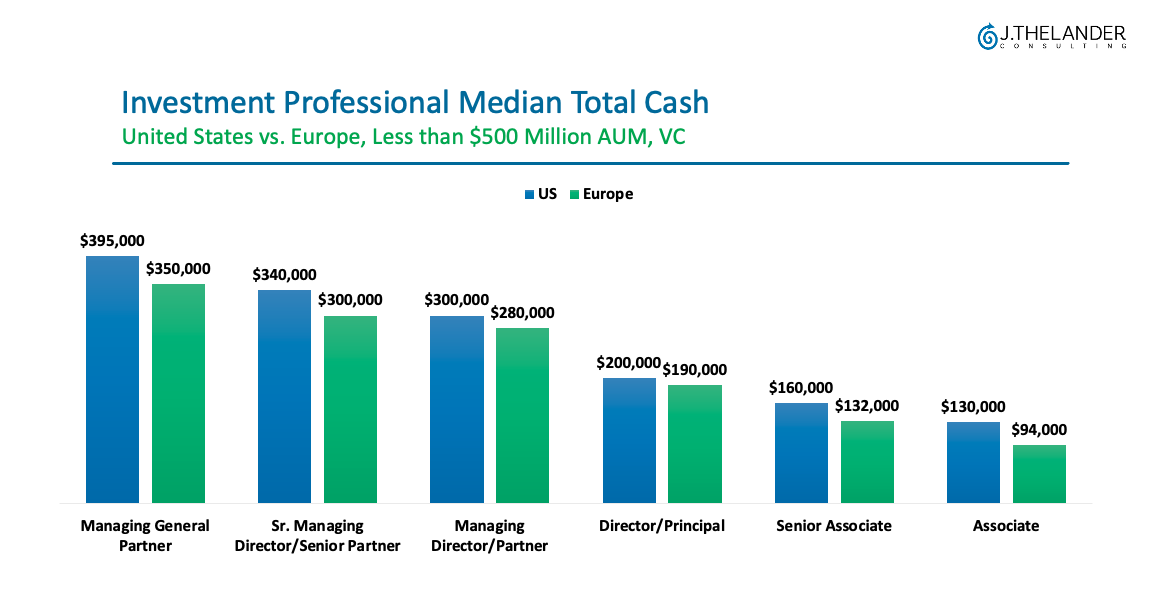
In the first graph we examine the median total cash for investment professionals in the United States and Europe. The job positions range from managing general partner to associate. For this dataset, we looked at venture capital firms with less than $500 million in total AUM. The median total cash is higher for all investment professionals in the United States than in Europe.
The second graph shows the median carried interest for investment professionals in the United States and Europe, using the same parameters as above. Similar to the first graph, the median carried interest percentage is higher for all positions in the United States than in Europe.
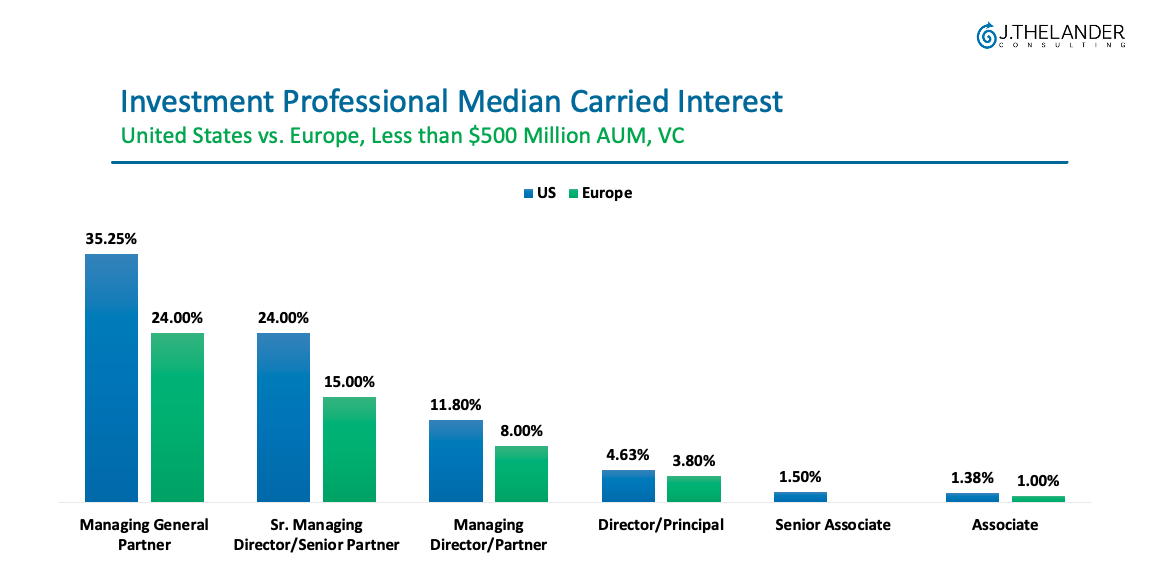
After examining the data from the Thelander-PitchBook Investment Firm Compensation Survey, the cash compensation in the United States is marginally more competitive, but close. There is a larger delta with carried interest.
| How does your firm’s compensation compare to the market? Learn how your base salary, bonuses, and carried interest compare! Participate in the Thelander-PitchBook Investment Firm Compensation Survey. There is no cost to participate and all respondents will receive a complimentary silver subscription for the year. All data is published in aggregate form only, with NO individual or firm names reported. |
Participate In The Investment Firm Compensation Survey
Tags: Investment Firm, Newsletter